Chart Styling - Image, Transparent or Blurred Backgrounds
New to SciChart.js v2.x and above, we now support transparent backgrounds, blurred backgrounds or image backgrounds behind charts.
You can create stunning designs and visual effects with SciChart.js as well as support advanced features such as charting over a background image or tiles of images.
Read on for how to enable this:
Transparent Backgrounds in Charts
SciChart.js v2.x and above now properly supports Transparent Backgrounds on charts, allowing you to show through the underlying DOM in your page.
To use this, simply set sciChartSurface.background = Transparent, or have Transparent in the theme. You can also use semi-transparent backgrounds, e.g. "#FFFFFF33"
<!-- HTML -->
<div style="padding: 20px; background: repeating-linear-gradient(45deg, #606dbc, #606dbc 10px,#465298 10px,#465298 20px)">
    <p style="color: white;">This chart has a transparent background</p>
    <div id="scichart-div-id-1" style="width: 800px; height: 600px;"></div>
</div>

// Js
import {SciChartSurface} from "scichart/Charting/Visuals/SciChartSurface";
import {NumericAxis} from "scichart/Charting/Visuals/Axis/NumericAxis";
import {SciChartJSLightTheme} from "scichart/Charting/Themes/SciChartJSLightTheme";
// Where divId is the ID of the div you wish to place SciChart
export async function transparentBackground(divId) {
    const theme = {... new SciChartJSLightTheme()};
    theme.tickTextBrush = "White";
    // You can set a SciChartSurface background transparent in the theme
    theme.sciChartBackground = "Transparent"
    theme.loadingAnimationBackground = "Transparent";
    const { sciChartSurface, wasmContext } = await SciChartSurface.create(divId,{ theme });
    // Or you can set it in code
    // SciChart also supports semi-transparent backgrounds like this
    sciChartSurface.background = "#FFFFFF33";
    sciChartSurface.xAxes.add(new NumericAxis(wasmContext));
    sciChartSurface.yAxes.add(new NumericAxis(wasmContext));
}
This results in the following output:
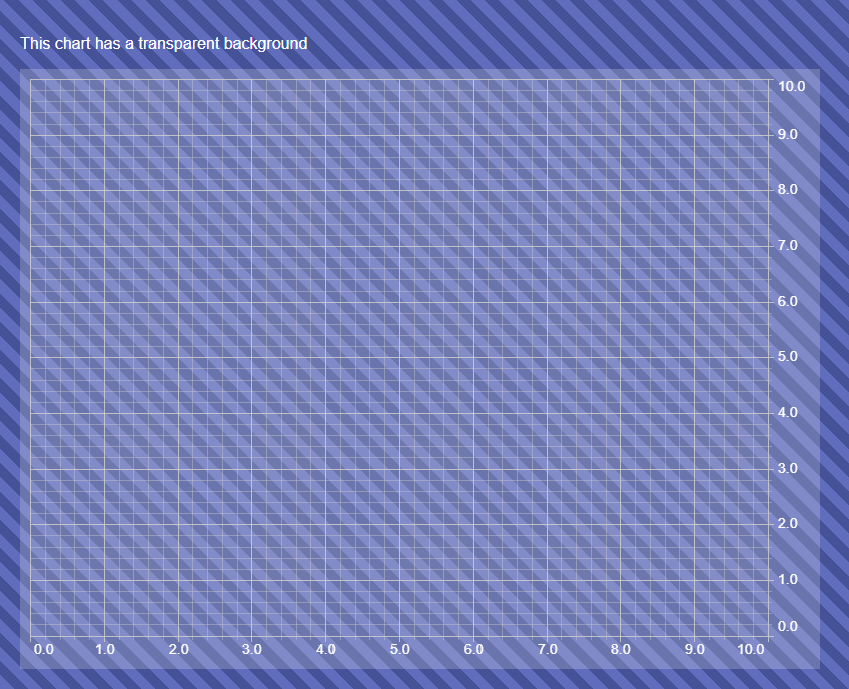
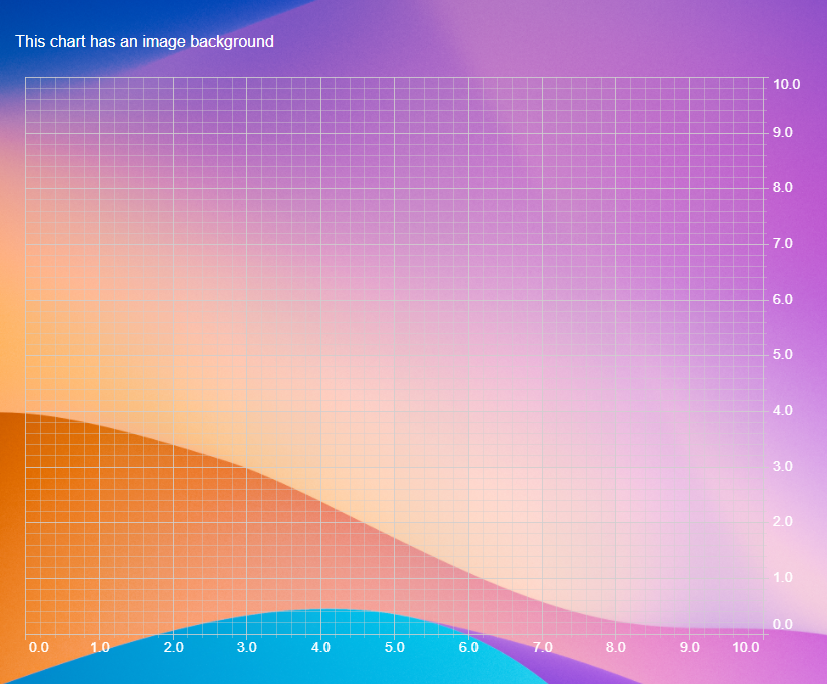
Image Backgrounds in Charts
As Transparent Backgrounds are now supported, so are image backgrounds. You can place an image background behind a chart using the following code:
<!-- HTML -->
<div style="padding: 20px; background-image: url('https://images.unsplash.com/photo-1618005182384-a83a8bd57fbe'); background-size: 100%">
    <p style="color: white;">This chart has an image background</p>
    <div id="scichart-div-id-2" style="width: 800px; height: 600px;"></div>
</div>

// JS
import {SciChartSurface} from "scichart/Charting/Visuals/SciChartSurface";
import {NumericAxis} from "scichart/Charting/Visuals/Axis/NumericAxis";
import {SciChartJSLightTheme} from "scichart/Charting/Themes/SciChartJSLightTheme";
// Where divId is the ID of the div you wish to place SciChart
export async function imageBackground(divId) {
    // Ensure background transparent to show the image through
    const theme = {... new SciChartJSLightTheme()};
    theme.tickTextBrush = "White";
    theme.sciChartBackground = "Transparent"
    theme.loadingAnimationBackground = "Transparent";
    const { sciChartSurface, wasmContext } = await SciChartSurface.create(divId,{ theme });
    sciChartSurface.xAxes.add(new NumericAxis(wasmContext));
    sciChartSurface.yAxes.add(new NumericAxis(wasmContext));
}
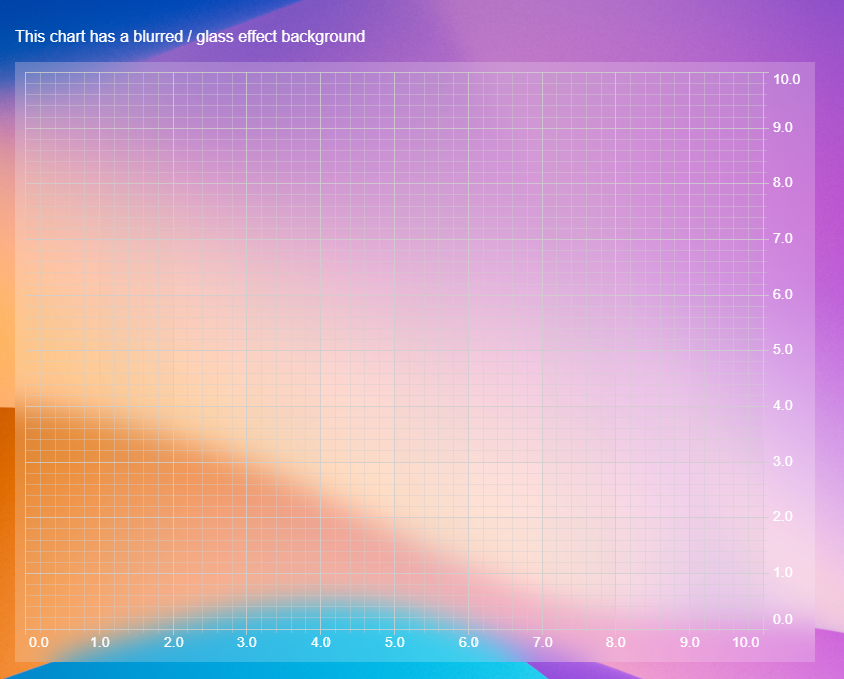
Blurred / Glass Effect Backgrounds in Charts
Since Transparent Backgrounds are supported, a few tricks in CSS and you can now achieve blurred / glass effect backgrounds in SciChart.
Try modifying the code above as follows:
<!-- HTML -->
<div style="padding: 20px; background-image: url('https://images.unsplash.com/photo-1618005182384-a83a8bd57fbe'); background-size: 100%">
    <p style="color: white;">This chart has a blurred / glass effect background</p>
    <div id="scichart-div-id-3" style="backdrop-filter: blur(15px); width: 800px; height: 600px;"></div>
</div>

// JS
import {SciChartSurface} from "scichart/Charting/Visuals/SciChartSurface";
import {NumericAxis} from "scichart/Charting/Visuals/Axis/NumericAxis";
import {SciChartJSLightTheme} from "scichart/Charting/Themes/SciChartJSLightTheme";
// Where divId is the ID of the div you wish to place SciChart
export async function blurredBackground(divId) {
    // Ensure background almost transparent to show the image through
    const theme = {... new SciChartJSLightTheme()};
    theme.tickTextBrush = "White";
    theme.sciChartBackground = "#FFFFFF22"
    theme.loadingAnimationBackground = "#FFFFFF22";
    const { sciChartSurface, wasmContext } = await SciChartSurface.create(divId,{ theme });
    sciChartSurface.xAxes.add(new NumericAxis(wasmContext));
    sciChartSurface.yAxes.add(new NumericAxis(wasmContext));
}
This results in the following output:
Conclusion
So you can see now that SciChart.js supports a myriad of options for styling the background of the chart to create stunning visual effects.
See also our documentation below on styling & themeing, including colouring chart parts and creating custom themes.
See Also
